Discover the power of Spring Boot 3 observability for performance monitoring and gain valuable insights. Track execution time that can be useful for optimizing critical sections, and elevate your application’s performance.
Introduction
In our previous blog post Monitoring Made Easy, we discussed how we can measure API response time in Spring Boot. Now, we take a deeper dive into the world of observability in Spring Boot 3. We will explore the concept of observability in Spring Boot 3, uncovering its powerful capabilities for performance monitoring and insights. We’ll discover methods to track execution time and utilize real-time monitoring to unlock the full potential of your application.
What is Observability?
Observability is about getting a clear picture of what’s happening inside an application. It’s like having superpowers to see everything that’s going on. To achieve observability, we use tools and techniques to collect data from different sources like logs, metrics, and tracing. This data helps us understand how the application is performing, find any problems, and make smart decisions to improve it. By practicing observability, developers and system administrators can keep an eye on the application, spot any issues or slowdowns, and make sure it’s running smoothly and efficiently.
Before we can understand how we can use Observability in Spring Boot 3 application, we need to understand a few basic concepts related to Observability.
Observability Handlers and Registries
Observability handlers and registries are essential components in Spring Boot 3 that help us monitor the performance of our applications.
- Observability Handlers
Observability handlers are responsible for capturing events during the execution of methods or services. They allow us to measure the execution time, handle exceptions, and perform additional actions. We can even create our own custom handlers to meet specific monitoring needs. - Observability Registries
Observability registries act as centralized repositories for storing and managing observed metrics. They help us organize and analyze the data collected from the observability handlers. These registries provide a consolidated view of the application’s performance and allow us to identify patterns and trends.
Observed Aspect and Observed Annotation
- Observed Aspect
TheObservedAspectis an aspect-oriented programming component in Spring Boot 3 that allows us to apply observability to our code. It works in conjunction with the @Observed annotation.
- Observed Annotation
The@Observedannotation is applied to methods or classes and enables observability for them. When applied at the method level, it measures the execution time of that specific method. When applied at the class level, it monitors all the methods within that class.
By using the ObservedAspect and @Observed annotation, we can easily track the execution time of our methods or classes and gain insights into their performance. This helps us identify areas where optimization is needed and enables us to deliver better-performing applications.
How to Measure Execution Time
In order to understand how to measure method and class execution time using Spring Boot 3 Observability, we need to follow these steps:
Step 1: Add Spring Boot Actuator and AOP Dependency
Include the Spring Boot Actuator dependency and Spring Boot AOP dependency in your Spring Boot project.
<dependency>
    <groupId>org.springframework.boot</groupId>
    <artifactId>spring-boot-starter-actuator</artifactId>
</dependency>
<dependency>
    <groupId>org.springframework.boot</groupId>
    <artifactId>spring-boot-starter-aop</artifactId>
</dependency>Spring boot AOP dependency is mandatory or else the application will fail to start.
Step 2: Custom Observability Handlers for Performance Monitoring
While Spring Boot 3 provides default observability handlers, we can also create our own custom handlers to meet specific monitoring requirements. By implementing a custom handler, we can log the start and stop events of the method or service execution, measure the execution time, handle errors or exceptions, and perform additional actions such as publishing metrics.
Example:
import io.micrometer.observation.Observation;
import io.micrometer.observation.ObservationHandler;
import org.slf4j.Logger;
import org.slf4j.LoggerFactory;


public class PerformanceMonitoringHandler implements ObservationHandler<Observation.Context> {

    private static final Logger log = LoggerFactory.getLogger(PerformanceMonitoringHandler.class);

    @Override
    public void onStart(Observation.Context context) {
        log.info("Execution Started: {}", context.getName());
        context.put("executionTime", System.currentTimeMillis());
    }

    @Override
    public void onStop(Observation.Context context) {
        long startTime = context.getOrDefault("executionTime", 0L);
        long executionTime = System.currentTimeMillis() - startTime;
        log.info("Execution Stopped: {} | Total Time Taken: {} ms", context.getName(), executionTime);
    }

    @Override
    public void onError(Observation.Context context) {
        log.info("Error Encountered: {} | Error: {}", context.getName(), (context.getError() != null ? context.getError().getMessage() : null));
    }

    @Override
    public boolean supportsContext(Observation.Context context) {
        return true;
    }
}This code defines a class called PerformanceMonitoringHandler that implements the ObservationHandler interface from the Micrometer library. It is responsible for handling observations related to performance monitoring in an application.
The class includes methods to handle the start, stop, and error events that occur during the monitoring process.
In the onStart method, when the monitoring starts, it logs a message indicating the execution has begun, along with the name of the observed context. It also records the current time as the start time in the context.
In the onStop method, when the monitoring stops, it calculates the execution time by subtracting the start time from the current time. It then logs a message indicating the execution has stopped, along with the name of the observed context and the total time taken for execution.
In the onError method, when an error is encountered during the monitoring process, it logs a message indicating the error and the name of the observed context.
The supportsContext method always returns true, indicating that this handler supports all observation contexts. Returning true allows this handler to be called for all observation events, such as when monitoring starts, stops, or encounters errors. As a result, the corresponding methods (onStart, onStop, onError) within this handler will be invoked for any observation context, and the desired actions, such as logging relevant information, can be performed. Returning false in the supportsContext method indicates that the handler is not capable of handling or processing the given context. As a result, when the monitoring system tries to invoke this handler for a specific observation context, it will skip this handler and look for another handler that supports the context.
By logging relevant information, such as execution time and errors, it provides insights into the performance and health of the application during runtime.
Step 3: Registering Custom Handler with the ObservationRegistry
To use our custom PerformanceMonitoringHandler, we need to register it with the ObservationRegistry. Here’s an example configuration class demonstrating how to register the custom handler:
import com.bootcamp.observability.handler.PerformanceMonitoringHandler;
import io.micrometer.observation.ObservationRegistry;
import io.micrometer.observation.aop.ObservedAspect;
import org.springframework.context.annotation.Bean;
import org.springframework.context.annotation.Configuration;

@Configuration
public class ApplicationConfig {

    @Bean
    public RestTemplate restTemplate(RestTemplateBuilder builder) {
        return builder.build();
    }

    @Bean
    public ObservedAspect observedAspect(ObservationRegistry observationRegistry) {
        observationRegistry.observationConfig().observationHandler(new PerformanceMonitoringHandler());
        return new ObservedAspect(observationRegistry);
    }
}The ApplicationConfig class is responsible for configuring the performance monitoring aspect of the application. It creates a bean named observedAspect, which sets up the necessary components for observing and monitoring the performance of the application.
By defining the observedAspect bean, the code specifies that performance monitoring should be applied to relevant parts of the application. This monitoring is facilitated by an ObservationRegistry, which keeps track of observations.
The code configures the ObservationRegistry by setting the observation handler to a PerformanceMonitoringHandler. This means that whenever an observation event occurs, such as the start or stop of an operation, the PerformanceMonitoringHandler will handle it.
In essence, this code ensures that the PerformanceMonitoringHandler is in place to monitor and capture performance-related information during the execution of the application. The observedAspect bean, along with the configured ObservationRegistry and PerformanceMonitoringHandler, allows for effective performance monitoring and analysis within the application.
Step 4: Leveraging Execution Time Observation
To observe the execution time of a method or service, we can annotate it with @Observed. The annotation can be applied at both the method level and the class level. Here’s an example of how to use the annotation:
import io.micrometer.observation.annotation.Observed;
import org.springframework.beans.factory.annotation.Autowired;
import org.springframework.stereotype.Service;
import org.springframework.web.client.HttpClientErrorException;
import org.springframework.web.client.HttpServerErrorException;
import org.springframework.web.client.ResourceAccessException;
import org.springframework.web.client.RestTemplate;

@Service
public class HttpBinService {

    @Autowired
    private RestTemplate restTemplate;

    @Observed(name = "http.bin.service.retrieve.data")
    public String retrieveData() {
        String sampleResponse = null;
        try {
            sampleResponse = restTemplate.getForObject("https://httpbin.org/get/123", String.class);
        } catch (HttpServerErrorException httpServerErrorException) {
            System.out.println("Received HTTP server error exception while fetching the details. Error Message: " + httpServerErrorException.getMessage());
            throw httpServerErrorException;
        } catch (HttpClientErrorException httpClientErrorException) {
            System.out.println("Received HTTP client error exception while fetching the details. Error Message: " + httpClientErrorException.getMessage());
            throw httpClientErrorException;
        } catch (ResourceAccessException resourceAccessException) {
            System.out.println("Received Resource Access exception while fetching the details.");
            throw resourceAccessException;
        }
        return sampleResponse;
    }
}
In this code, the HttpBinService class is a Spring service that retrieves data from the “https://httpbin.org/get” endpoint. The @Observed annotation, provided by Micrometer, is used to monitor the performance of the retrieveData() method by capturing important metrics like response times and error rates. This helps in analyzing and optimizing the service’s performance.
import com.bootcamp.observability.service.HttpBinService;
import io.micrometer.observation.annotation.Observed;
import org.springframework.beans.factory.annotation.Autowired;
import org.springframework.http.ResponseEntity;
import org.springframework.web.bind.annotation.GetMapping;
import org.springframework.web.bind.annotation.RestController;

@RestController
@Observed(name = "observability.controller")
public class ObservabilityController {

    @Autowired
    private HttpBinService httpBinService;

    @GetMapping("/data")
    public ResponseEntity<String> retrieveSampleData() {
        String sampleData = httpBinService.retrieveData();
        return ResponseEntity.ok(sampleData);
    }
}
In this code, the ObservabilityController class is a Spring REST controller responsible for handling requests for the /data endpoint. The @Observed annotation allows for the monitoring of the ObservabilityController class, providing insights into its performance metrics such as response times.
Step 5: Verifying Output
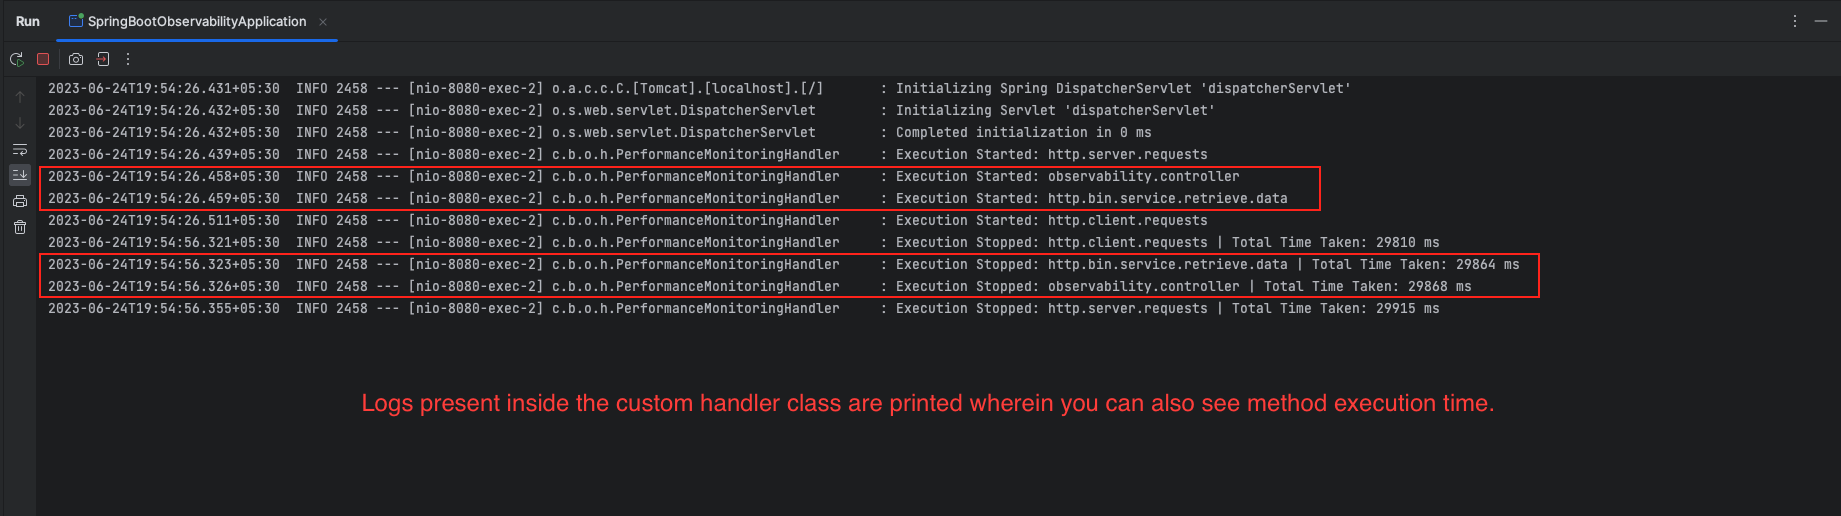
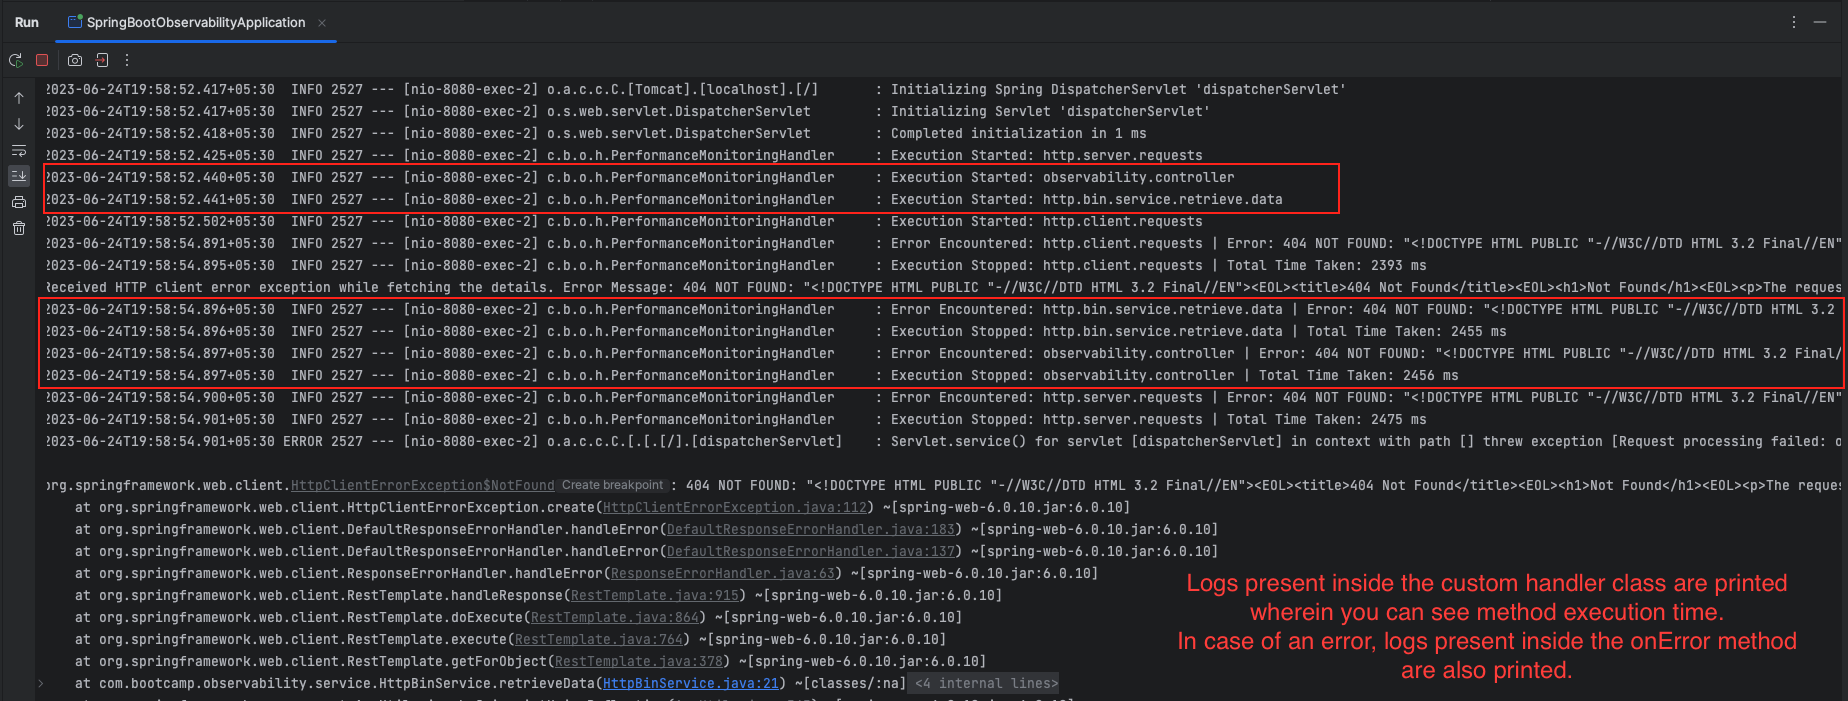
When an application is started and GET request is sent to /data endpoint, corresponding logs related to execution time will be printed. You will see that the methods present inside the PerformanceMonitoringHandler custom handler class are invoked and execution time and error information are printed.
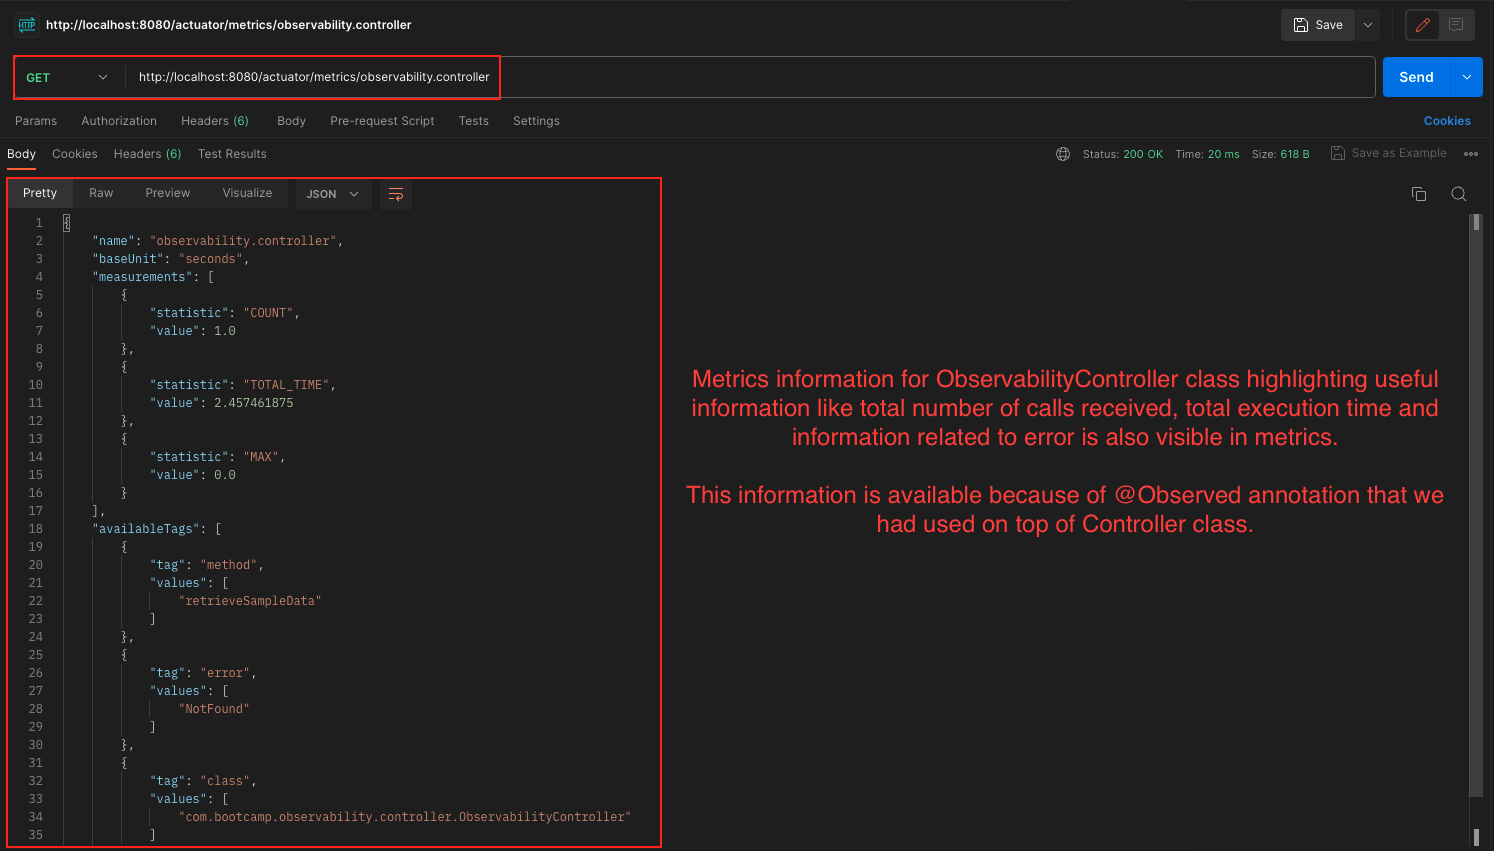
Also, the service method and controller class are annotated with @Observed annotation, the metrics information highlighting the total count, total time, and other useful information like error information will also be visible inside the metrics actuator endpoint.
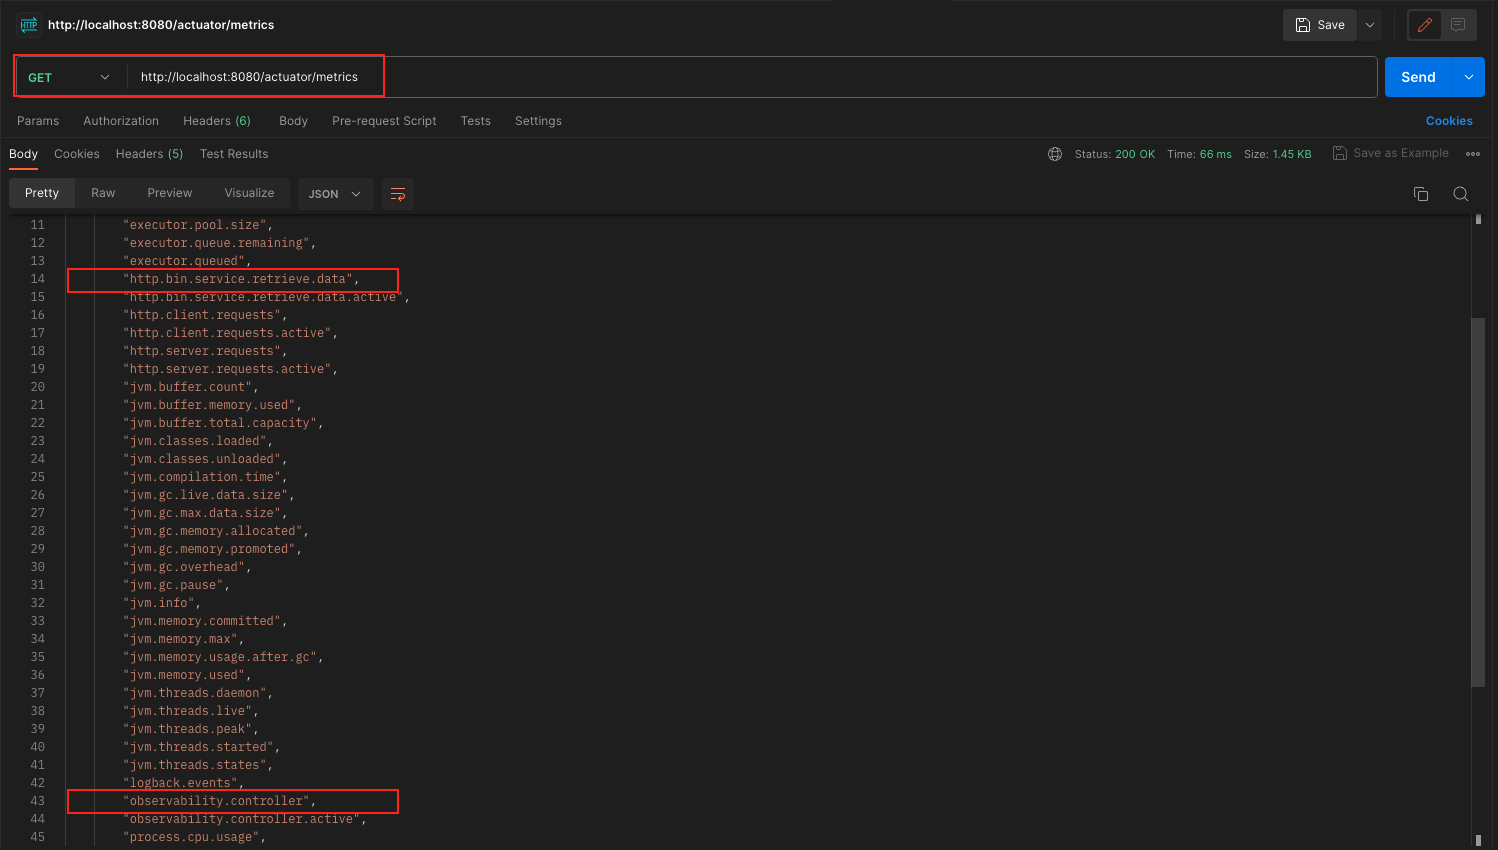

If actuator metrics are not visible in your application, do not forget to include the below configuration in application.properties of your application.management.endpoints.web.exposure.include=*
Comparing @Observed Annotation at Class and Method Level
The @Observed annotation can be used both at the class level and the method level. Here’s how they differ:
- @Observed at Class Level:
When the@Observedannotation is applied at the class level, it indicates that all methods within that class should be monitored and have their performance metrics captured. This means that all the methods in the class will be instrumented for performance monitoring, and their metrics will be collected and recorded. - @Observed at Method Level:
When the@Observedannotation is applied at the method level, it specifically targets and monitors individual methods. It allows for the tracking and capturing of performance metrics for those specific methods only. By applying the annotation selectively to certain methods, you can choose which methods to monitor and collect metrics for, while leaving others unaffected.
In summary, applying @Observed at the class level monitors all methods within the class, while applying it at the method level allows for selective monitoring of specific methods, based on your monitoring requirements and the level of granularity you need for capturing performance metrics.
Source Code
The complete source code of the above example can be found here.
FAQs
Can I use multiple custom handlers with the ObservationRegistry?
Yes, you can register multiple custom handlers with the ObservationRegistry to perform different observations or add specific functionality.
How can I track execution time for specific methods or services?
Simply apply the @Observed annotation to the desired methods or classes, and monitor their execution time and other details via actuator endpoints.
Are there any performance overheads associated with observability?
While there is a minimal performance overhead associated with observability due to the additional monitoring and logging operations, the benefits of gaining insights into application behavior far outweigh this overhead. It is recommended to measure and assess the impact on your specific application’s performance.
Can I integrate observability metrics with external monitoring and logging systems?
Yes, Spring Boot 3 observability can be integrated with various monitoring and logging systems, such as Prometheus, Grafana, ELK Stack (Elasticsearch, Logstash, Kibana), and more. This allows you to aggregate and visualize observability metrics alongside other system monitoring data.
Things to Consider
Here are some important considerations to keep in mind related to Observability:
- Granularity of Observation: Consider the level of granularity at which you want to observe execution time. You can choose to monitor individual methods or specific classes based on your application’s requirements.
- Exception Handling Strategy: Determine how you want to handle exceptions encountered during method or service execution. You can log the exceptions, customize error messages, or trigger specific actions based on the type of exception.
- Scalability and Performance Impact: Keep in mind the potential impact on performance and scalability when enabling execution time observation. Evaluate the trade-off between obtaining detailed execution time data and maintaining optimal application performance.
- Observing External Dependencies: Consider extending the observation capabilities to include execution time measurements of external dependencies, such as API calls or database interactions, to gain a comprehensive understanding of the overall system performance.
- Integration with Monitoring and Alerting Systems: Explore integration options with monitoring and alerting systems to proactively identify and respond to performance issues. This can include tools like Prometheus, Grafana, or application performance monitoring (APM) solutions.
- Continuous Optimization: Regularly analyze the execution time metrics and identify areas for improvement. Optimize the identified sections by implementing performance-enhancing techniques, such as caching, algorithmic optimizations, or database query optimizations.
Conclusion
Observability in Spring Boot 3 is a powerful tool for monitoring the performance of your applications. By leveraging observability handlers, applying the @Observed annotation, and utilizing observability registries, you can gain valuable insights into method and service execution time, handle exceptions, and optimize critical sections. Implementing observability techniques empowers you to deliver high-performance applications and proactively address performance issues.
Learn More
Interested in learning more?
Check out our blog on how to build fault-tolerant applications using Resilience4j retry.
Add a Comment