
In this blog, we’ll understand how to monitor API response time in the Spring Boot application with ease. By following these simple steps, you can measure and optimize your application’s performance for a better user experience. Keep reading to learn more about how to measure the API response time.
Context
API response time is a critical metric that developers must monitor to ensure the smooth functioning of their Spring Boot applications. The response time of an API refers to the amount of time it takes for the application to return a response to a given request. Monitoring API response time can help developers detect and resolve issues that affect the performance of the application.
Now, we will see different ways to measure the API response time.
Method 1: Using Spring Boot Actuator Built-in Mechanism
Spring Boot Actuator provides a built-in mechanism to measure API response time using the http.server.requests metrics. The http.server.requests metric records the duration of each request received by the Spring Boot application. By analyzing this metric, you can measure the response time of your API and identify any performance issues.
Here are the steps to measure API response time using the http.server.requests metrics in a Spring Boot application:
Step 1: Enable Actuator First, you need to enable Actuator in your Spring Boot application. You can do this by adding the following dependency to your pom.xml file:
<dependency>
   <groupId>org.springframework.boot</groupId>
   <artifactId>spring-boot-starter-actuator</artifactId>
</dependency>
Step 2: You also need to enable the Actuator endpoints by adding the following property to your application.properties file:
management.endpoints.web.exposure.include=metrics
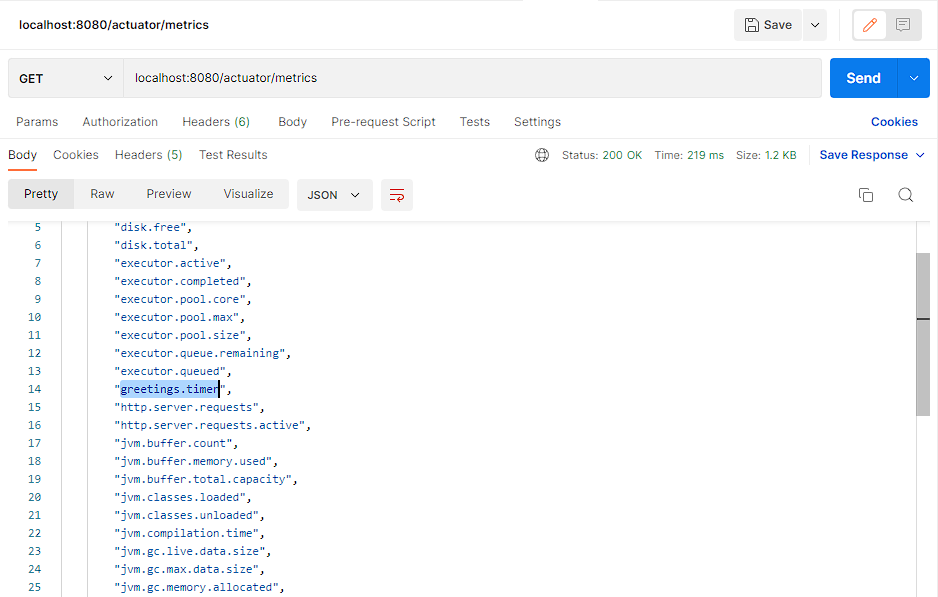
Step 3: Once you have exposed the metric endpoint, you can analyze it to measure the response time of your API. To check the metrics, you need to send a GET request to the actuator endpoint specifying the name of metrics we are interested in, in our case, http.server.requests. You can use tools like Grafana or Prometheus to visualize and analyze the metric data or you can simply check the output in postman.

Method 2: Using Micrometer @Timed Annotation
In Spring Boot, you can use the @Timed annotation to measure the time taken to execute a method and record the metrics using Micrometer.
What is Micrometer?
Micrometer is a metrics collection library that can be used with Spring Boot Actuator to record various metrics, including response time.
What is @Timed Annotation?
@Timed is an annotation provided by the Micrometer library that allows you to measure the time taken to execute a method. It records the metrics using the Micrometer registry, which can be configured to export the metrics to various monitoring systems such as Prometheus.
How to use @Timed Annotation?
Step 1: Enable Actuator First, you need to enable Actuator in your Spring Boot application. You can do this by adding the following dependency to your pom.xml file:
<dependency>
   <groupId>org.springframework.boot</groupId>
   <artifactId>spring-boot-starter-actuator</artifactId>
</dependency>
Step 2: You also need to enable the Actuator endpoints by adding the following property to your application.properties file:
management.endpoints.web.exposure.include=metrics
Step 3: Add the Micrometer dependency and AOP dependency to your Spring Boot project.
<dependency>
  <groupId>io.micrometer</groupId>
  <artifactId>micrometer-core</artifactId>
  <version>${micrometer.version}</version>
</dependency>
<dependency>
  <groupId>org.springframework.boot</groupId>
  <artifactId>spring-boot-starter-aop</artifactId>
</dependency>
Step 4: Create a TimedApsect bean and register it in the Spring context. You can create this bean inside the application main class or if you are making use of a class that is annotated with @Configuration then you can create the bean inside that class as well.
@Bean
TimedAspect timedAspect(MeterRegistry registry) {
  return new TimedAspect(registry);
}
The timedAspect bean takes a MeterRegistry object as an argument. This object is used to record the metrics collected by the TimedAspect.
Step 5: Add the @Timed annotation to the controller methods you want to measure:
import io.micrometer.core.annotation.Timed;
import org.springframework.web.bind.annotation.GetMapping;
import org.springframework.web.bind.annotation.RestController;

@RestController
public class HelloWorldController {

    @Timed(value = "greetings.timer", description = "Time taken to process my API endpoint")
    @GetMapping("/hello")
    public String sendGreetings() {
        return "Hello, World!";
    }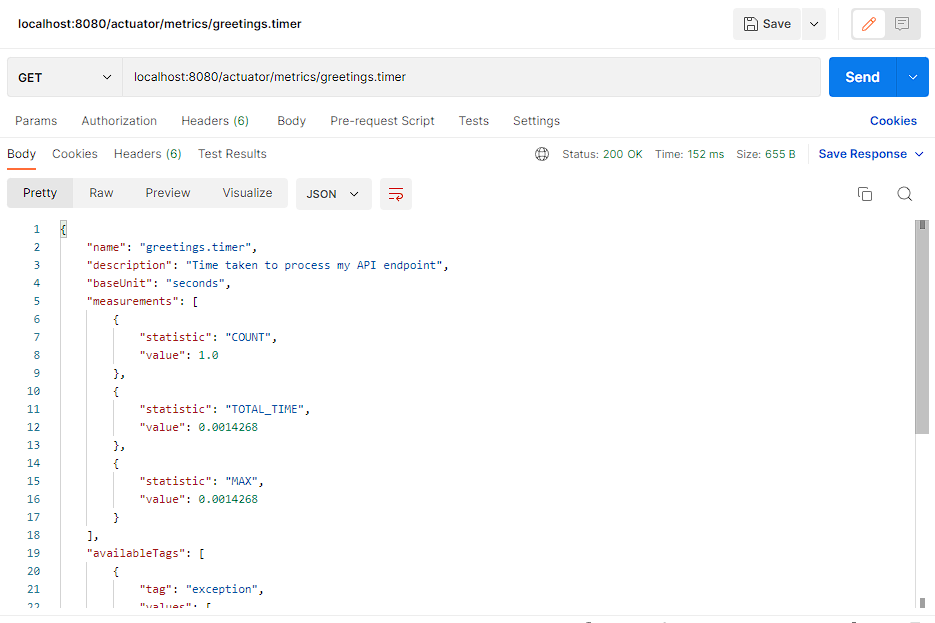
}Step 6: Now you measure the response time of your API by using the metrics endpoint. You can use tools like Grafana or Prometheus to visualize and analyze the metric data or you can simply check the output in postman.
Method 3: Using Micrometer Timer Object
This is very similar to the second method but instead of @Timed annotation, you can use the Timer.record() method to manually record the timing of a code block.
import io.micrometer.core.instrument.Timer;
import io.micrometer.core.instrument.simple.SimpleMeterRegistry;
import org.springframework.web.bind.annotation.GetMapping;
import org.springframework.web.bind.annotation.RestController;

@RestController
public class HelloWorldController {

    private Timer timer;

    private SimpleMeterRegistry simpleMeterRegistry;

    public HelloWorldController(SimpleMeterRegistry simpleMeterRegistry) {
        this.simpleMeterRegistry = simpleMeterRegistry;
        timer = simpleMeterRegistry.timer("greetings.timer");
    }

    @GetMapping("/hello")
    public String sendGreetings() {
        Timer.Sample sample = Timer.start();

        try {
            System.out.println("Doing some work");
            Thread.sleep(5000);
        } catch (Exception e) {
        }

        double responseTimeInMilliSeconds = timer.record(() -> sample.stop(timer) / 1000000);

        System.out.println("Greetings API response time: " + responseTimeInMilliSeconds + " ms");

        return "Hello, World!";
    }
}
Advantages of Timer Object
Both the Timer object and the @Timed annotation are effective ways to measure API response time in Spring Boot. However, there are some advantages to using the Timer object instead of the @Timed annotation:
- Application Logging: Using the timer object you can also print the response time in application logs which is not possible in the case of @Timed annotation.
- More flexibility: The
Timerobject allows you to measure the duration of a specific block of code, not just an entire method. This means you can get more granular measurements of your code’s performance and identify specific areas that need improvement. - Programmatic control: With the
Timerobject, you have more control over when and how measurements are taken. You can start and stop the timer at specific points in your code, or you can create multiple timers to measure different parts of your code.
Method 4: What if You Have Interceptors Before the Controller Methods?
If you have an interceptor before your controller methods, you can use the same approach as before to record the response time of your API endpoints. However, you’ll need to modify your interceptor to capture the start and end times of the API call and record the time taken using Micrometer.
Here’s an example of how to modify an interceptor to record API response time using a Micrometer:
Step 1: Create an Interceptor class and add the required code to capture and log the response time.
import io.micrometer.core.instrument.Timer;
import io.micrometer.core.instrument.simple.SimpleMeterRegistry;
import jakarta.servlet.http.HttpServletRequest;
import jakarta.servlet.http.HttpServletResponse;
import org.springframework.beans.factory.annotation.Autowired;
import org.springframework.stereotype.Component;
import org.springframework.web.servlet.HandlerInterceptor;
import java.util.concurrent.TimeUnit;
@Component
public class MyInterceptor implements HandlerInterceptor {
private Timer timer;
private SimpleMeterRegistry simpleMeterRegistry;
@Autowired
public MyInterceptor(SimpleMeterRegistry simpleMeterRegistry) {
this.simpleMeterRegistry = simpleMeterRegistry;
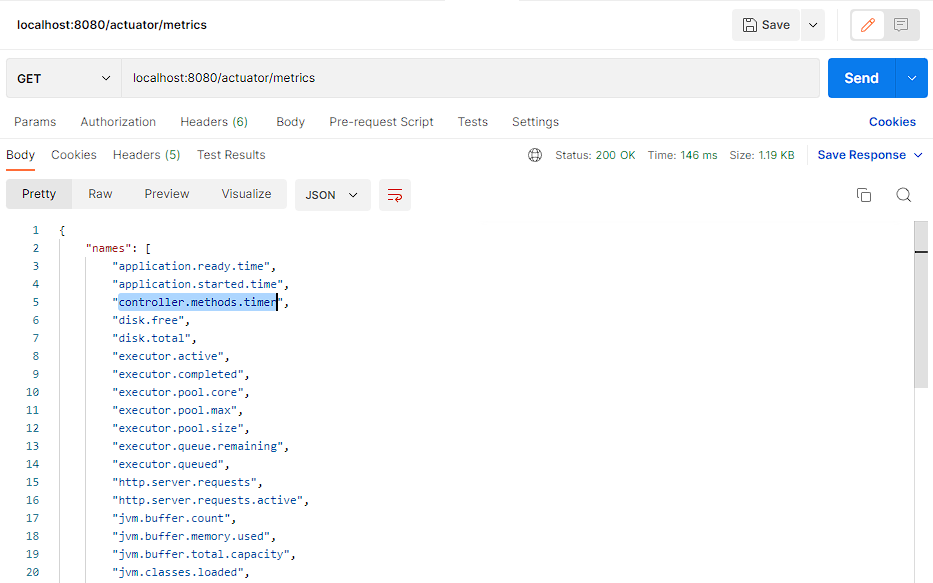
timer = simpleMeterRegistry.timer("controller.methods.timer");
}
@Override
public boolean preHandle(HttpServletRequest request, HttpServletResponse response, Object handler) throws Exception {
// Capture start time of API call
request.setAttribute("startTime", System.currentTimeMillis());
return true;
}
@Override
public void afterCompletion(HttpServletRequest request, HttpServletResponse response, Object handler, Exception ex) throws Exception {
// Capture end time of API call and calculate response time
long startTime = (long) request.getAttribute("startTime");
long endTime = System.currentTimeMillis();
long timeTaken = endTime - startTime;
// Record API response time using Micrometer
timer.record(timeTaken, TimeUnit.MILLISECONDS);
// Print response time to console
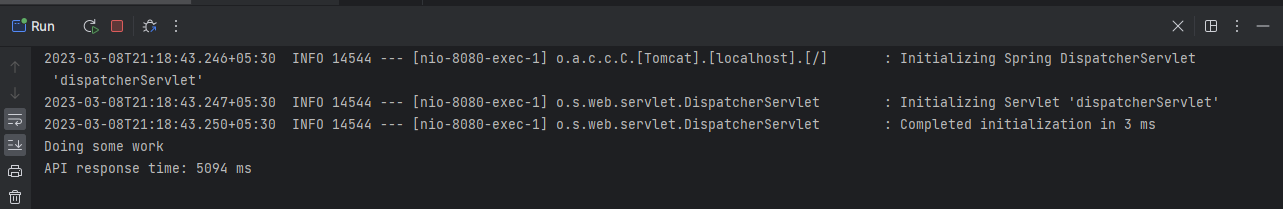
System.out.println("API response time: " + timeTaken + " ms");
}
}In this example, we’ve modified our interceptor to capture the start time of the API call in the preHandle() method, and the end time in the afterCompletion() method. We then calculate the time taken to process the API call, record it using the Micrometer Timer, and print it to the console. Finally, we return true in the preHandle() method to allow the request to continue processing.
Note:
Instead of the postHandle() method, you can add the code to stop the timer and measure the response time in afterCompletion() method because if an exception is encountered and not handled within your controller or application, the postHandle() method of your interceptor may not be called. This means that the end time of the API call may not be captured, and the response time may not be recorded. To handle this situation, you can implement the afterCompletion() method in your interceptor. This method is called after the response has been sent to the client, regardless of whether an exception was thrown or not.
Step 2: Register the above interceptor into the interceptor registry.
import com.example.helloworld.interceptor.MyInterceptor;
import org.springframework.context.annotation.Configuration;
import org.springframework.web.servlet.config.annotation.InterceptorRegistry;
import org.springframework.web.servlet.config.annotation.WebMvcConfigurer;

@Configuration
public class InterceptorConfig implements WebMvcConfigurer {

    private MyInterceptor myInterceptor;

    public InterceptorConfig(MyInterceptor myInterceptor) {
        this.myInterceptor = myInterceptor;
    }

    @Override
    public void addInterceptors(InterceptorRegistry registry) {
        registry.addInterceptor(myInterceptor);
    }
}
Step 3: Verify the output by checking the application logs and actuator metrics endpoint.

Conclusion
In conclusion, measuring API response time is an important aspect of monitoring and optimizing the performance of a Spring Boot application. There are several methods for measuring API response time, including using an interceptor, micrometer, and Spring Boot Actuator http.server.requests metrics.
Ultimately, the method you choose for measuring API response time will depend on the specific needs of your application. Whether you choose to use an interceptor, micrometer, or Spring Boot Actuator http.server.requests metrics, measuring API response time is an essential part of ensuring your application is performing at its best.
Add a Comment